One question, one finished chart
You bring a question. We test it against public data and build one chart that answers it.
- A headline that states the finding
- Sized for X, LinkedIn or your newsletter
- A source and limits note
- The cleaned data table
THQ Research is an independent research firm. As @THQResearch on X, we test the stories everyone is talking about against public data. Each chart here links to the question it tested, the source it came from, and what the data can't tell you.
Try every model in the Experiment lab, with comparisons and locally suggested scenarios.
Some questions are easier to understand when you change the inputs and watch the answer move. Each model here lets you do that, with every input traced to its source and every assumption stated on the page.
A model shows what happens under stated assumptions. It is research, not a forecast or a recommendation. Full disclaimer
Most THQ charts test a story against what already happened. A few make a call about what happens next. Each one is listed here the day it posts, with what would count as right and when the answer will be known. When it resolves, the result goes here too, hit or miss.
Calls on this page are research, not recommendations. A model's output is not a prediction you should trade on, and past results do not guarantee future ones. Full disclaimer
THQ Research is an independent research firm. We take the claims people repeat about markets, the economy, sports, health and the news, and check them against public data. Sometimes the data backs the story up. Sometimes it doesn't. Either way, we show the numbers and say where they came from.
We publish two charts a day on X as @THQResearch. Every one is archived here with the question it tested, the finding, the source and its limits. We also take on custom research for newsletters, funds, companies and media.
We aren't owned by a bank, a fund or a newsroom, so there is no house view to protect. Clients pay for the work, not for a conclusion. If the data points the other way from what someone hoped, we say so.
Every number on a chart traces back to one primary source, like a government agency, a company filing or exchange data. If a number can't be traced, it gets cut.
We keep what the data measured apart from what we conclude from it. Every chart lists what the data can't show, so nobody reads more into it than it holds.
When we make a call about the future, it goes on the scorecard the day it posts, and the result goes there too, hit or miss.
Whatever people are arguing about, as long as clean public data exists for it. So far that has meant the economy, markets, business, sports, science, health, weather, politics and culture.
THQ Research is published by Homan Quantitative Solutions LLC. Our research is for information and education. It is not investment advice, and nothing we publish is a recommendation to buy or sell anything. See the full disclaimer.
For custom work, see Work with THQ.
Everything on this site, in the THQ Research newsletter, in the pitch materials and in posts by @THQResearch on X is for information and education only. Please read this before you use any of it.
Nothing we publish is investment, financial, legal, tax or accounting advice. Nothing is a recommendation or an offer to buy, sell or hold any security, cryptocurrency, futures contract or other asset.
We are not a registered investment adviser, broker-dealer or financial planner. Our research is general and published the same way for everyone. It is not tailored to anyone's money, goals or situation.
Charts, models, simulations, odds and scorecard calls describe what the data showed or what a model produced under stated assumptions. They are not promises about what will happen. Past results, historical patterns and backtests do not guarantee future results. Markets can and do move in ways no model expects.
We trade, and we may hold positions in markets or assets we write about, including futures. Our research is not a signal to trade, and you should never assume our positions match what a chart shows.
We work to trace every number to a primary source, but data can contain errors, sources can revise their numbers, and we can make mistakes. Everything is provided as is, without any warranty. When we find an error, we correct it.
You are responsible for your own decisions. Do your own research and talk to a licensed professional before you invest, trade or make any financial decision. Homan Quantitative Solutions LLC is not liable for any loss or damage from using or relying on anything we publish.
Custom research is a paid service to produce charts and analysis. Clients pay for the work, not for a conclusion, and paid work is not an endorsement of any client, product or asset. The terms of each project are set in a written agreement.
THQ Research is published by Homan Quantitative Solutions LLC. Questions about this disclaimer can go to us on X.
We build research charts for newsletters, funds, companies and media. You bring the question. We find clean public data, test it, and hand you a finished chart in the same style as the archive.
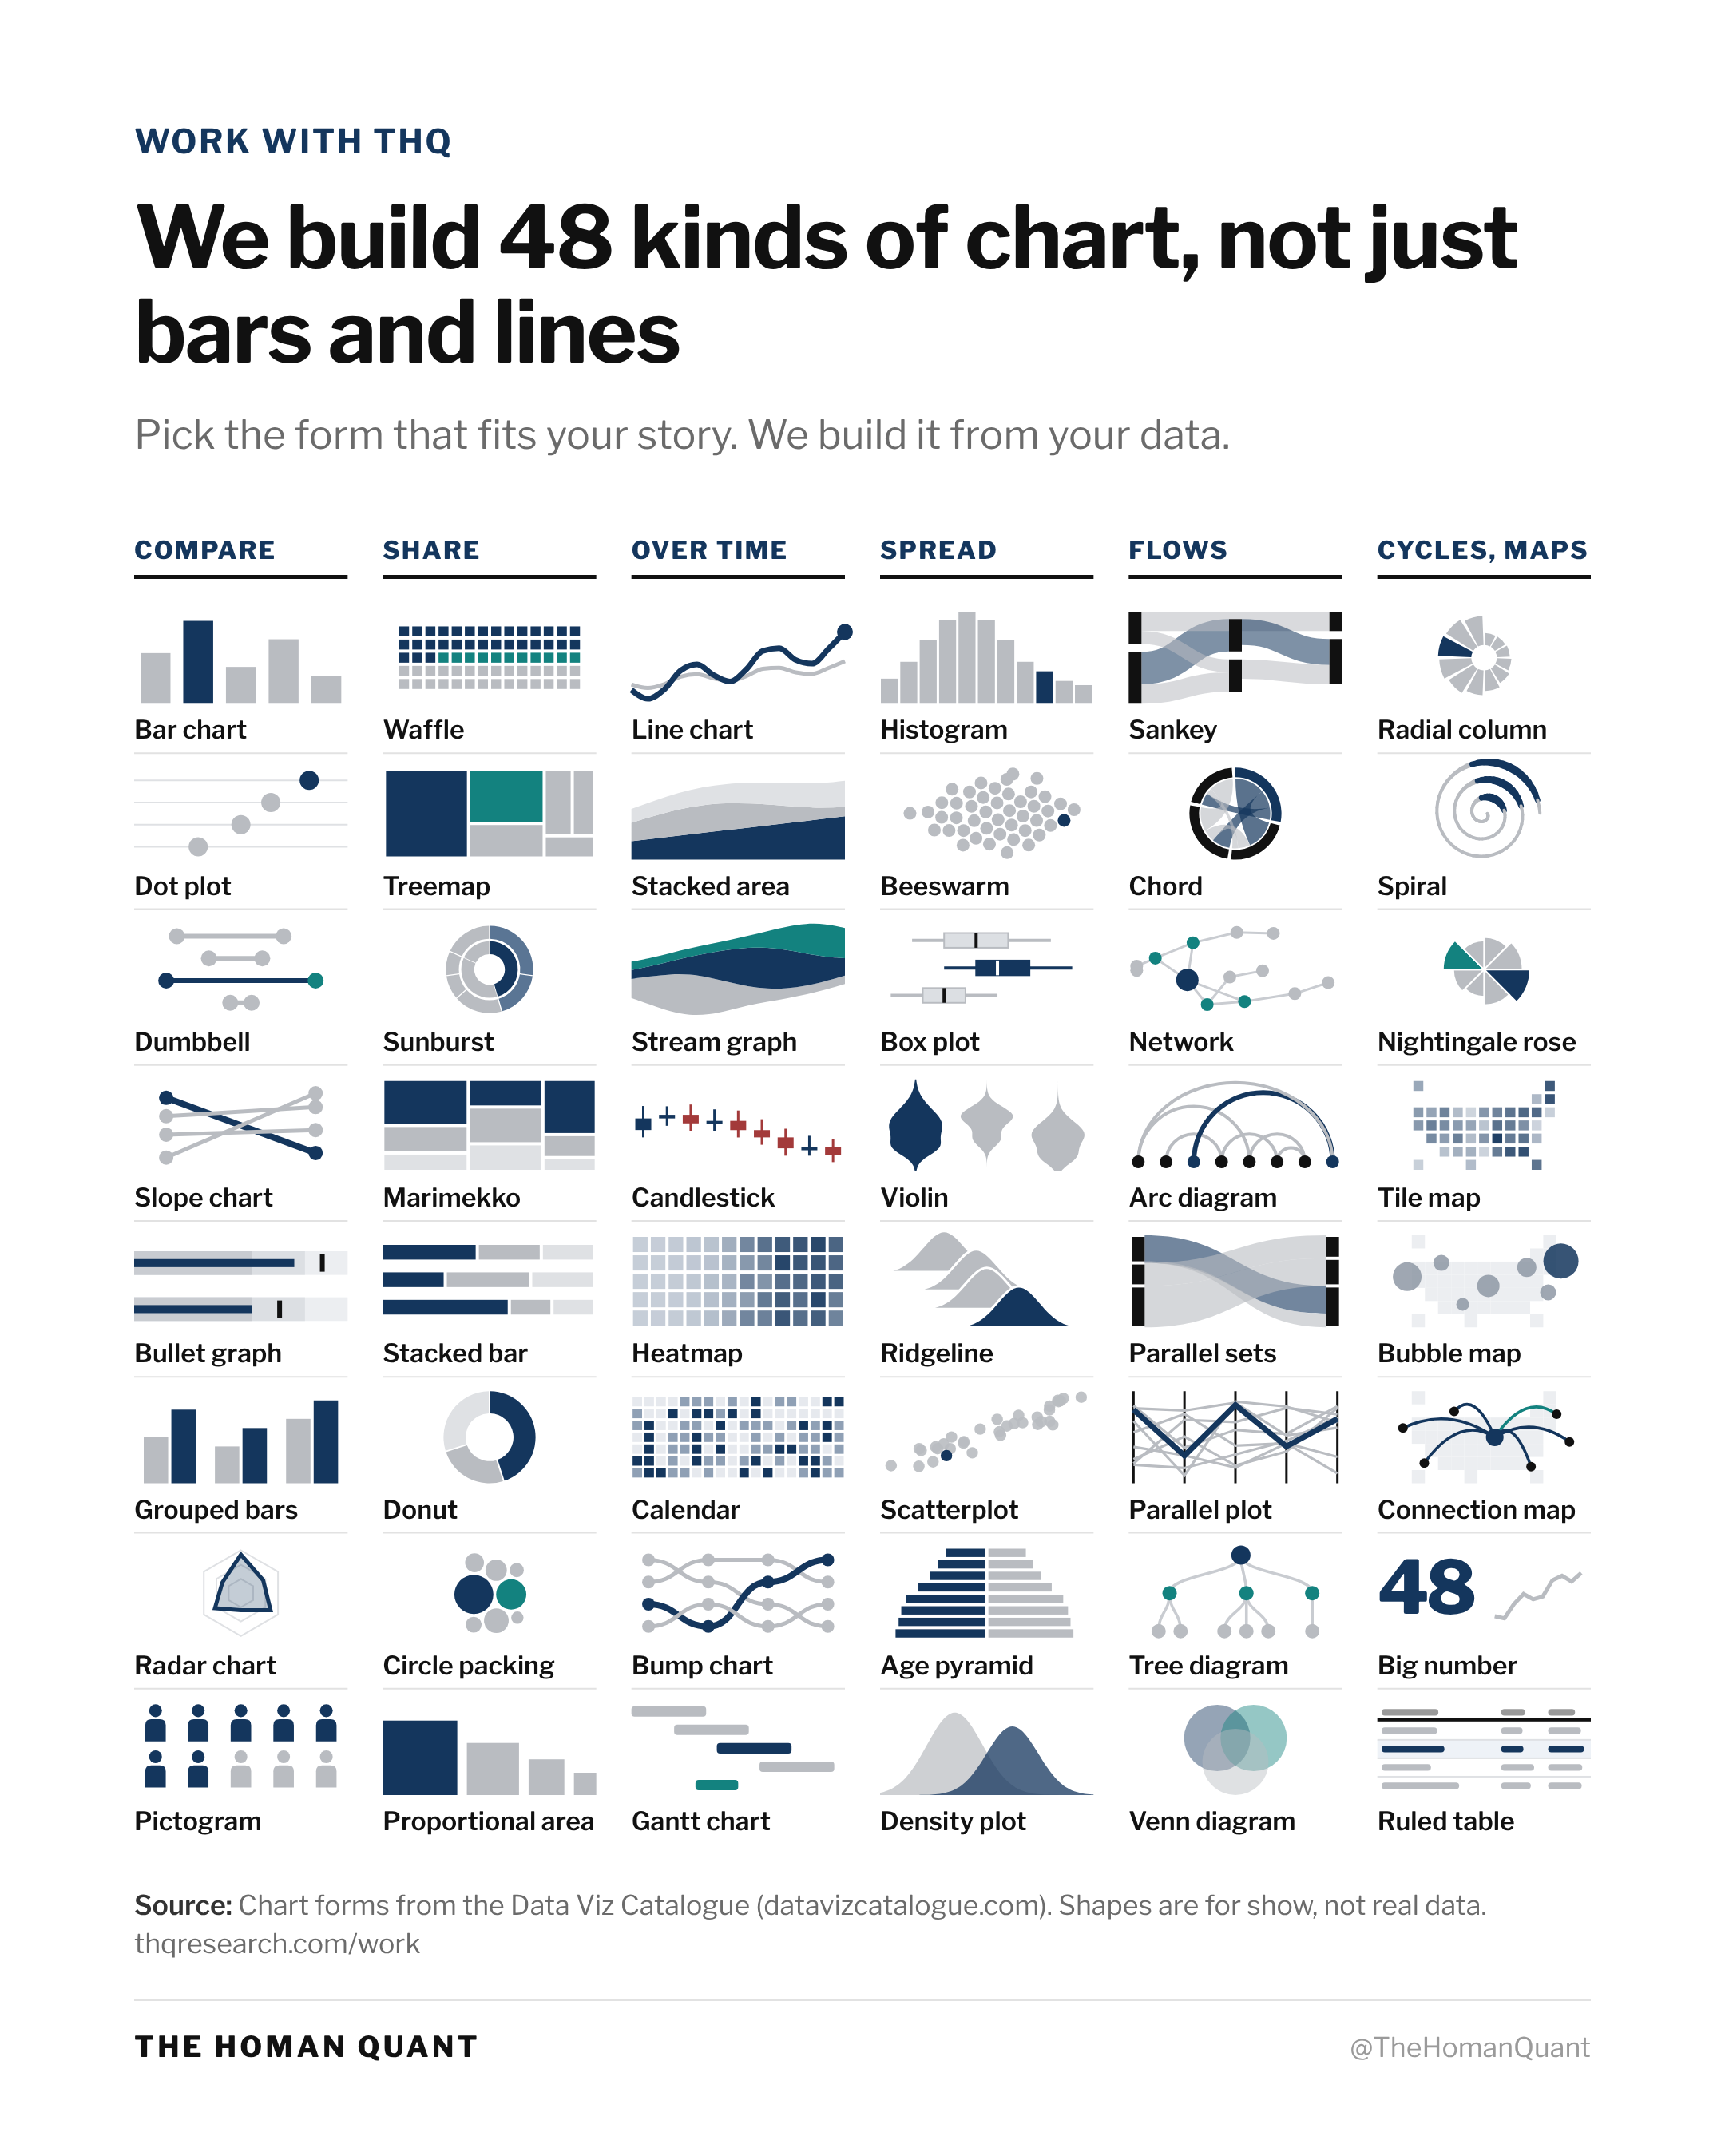
You bring a question. We test it against public data and build one chart that answers it.
Three to five charts with the findings written up in plain words, plus how we did it and what the data can't show.
A set number of charts each month on the subjects your readers or clients care about, built in your format.
Every project is quoted up front after we confirm the data exists. Download our overview (PDF)
Each figure traces to a primary source like an agency, a filing or exchange data. Anything we can't trace gets cut.
What the data measured, what it can't show, and where the numbers came from, so your readers can check it.
Every chart is made from code and saved data, so it can be updated when new numbers come out.
We won't make a chart say something the data doesn't. If the numbers point the other way from what you hoped, you'll hear that before anything gets drawn.